

In 2016 the results of a study1 were published identifying the opportunity dairies have to save money on feed costs purely based on feeder performance. The study was introduced because of high feed costs (at the time it represented 61-62% of the total production costs of Southern California dairies), which remains the same today.
So the question I want to ask is can you save a significant amount on production costs simply by tracking feeder deviation? Or even better, what opportunities do feeders have to contribute in a significant way to the bottom line of the operation simply by focusing in on deviation?
Both questions are basically the same question, but the second question may be more motivating and may better contribute to a positive and progressive mindset for your employees. That kind of mindset may help your operation improve in other areas as well...
What do we mean by Deviation?
When we’re talking about deviation, we’re referring to the difference between the amount of ingredient that was supposed to go in the ration versus the amount of the ingredient that actually went into the ration.
The study I mentioned showed that out of the 26 participating dairies, a significant number had problems overfeeding ingredients. The challenge most nutritionists face when they create a ration is that there is almost always a difference between what was formulated and what was actually fed. There are many variables like the amount of dry matter and the quality of the ingredients, but the biggest variable may simply be the amount of each ingredient added to the total ration.
There are several problems deviations cause and several questions you could ask that have a financial impact on your operation:
- What happens if too much of an ingredient gets added?
- What types of ingredients are harder to add accurately?
- How does the out-of-balance ration affect the cow’s health?
Transitioning from Feed Sheets to Feed Software: A Case Study
Over and over again, we have experienced setting up EZfeed on a farm that has been using feed sheets to create their cow rations. Most of the time these farms feel like they do a pretty good job. However, they are looking at software because they want to know they are doing a good job.

Recently we had another experience and thought it would be helpful to share. This farm, like most farms, wanted to know how they were doing… but were not prepared for how much deviation was contributing to wasted money they were spending feeding their cows.
What follows is a real story of a group that was feeding cows using feed sheets. They decided to start using EZfeed and we tracked the results over a 2 1/2 month period.
Feeding with EZfeed Day 1
Let’s break down the following EZfeed screenshot. This represents the reported results after they continued to do what they had already been doing. All we did was add the ingredients and rations into EZfeed and connected EZfeed tablet software to the scales. The feeders were using the same equipment they were used to – the only difference is that now we were tracking what was happening… and here are the results:
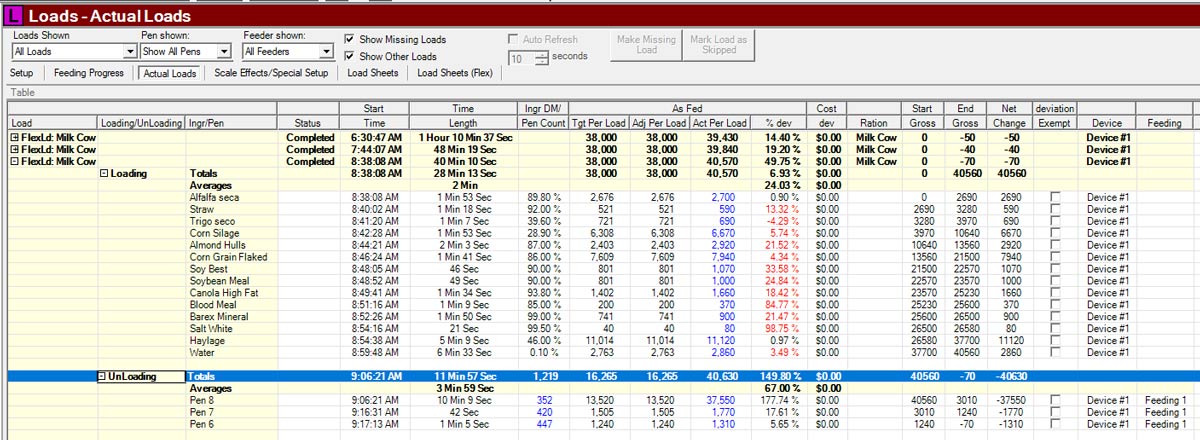
- The list of ingredients following the Loading column shows when the ingredient was loaded, how long it took to load, the target amount for the ingredient, and the actual amount that was loaded.
- The percentages in red show a deviation from what should have been loaded versus what was actually loaded.
- Some of the common ingredients weren’t too far off.. but were still as high as 20% more than what was needed.
- The real concerning thing were the higher dollar ingredients (which also are harder to load because of the smaller amounts needed) that deviated as much as two times the amount needed.
- The next list is the Unloading column showing how the feed was delivered to the pens. The same things are tracked: when it was unloaded, how much time it took, what the target amount to drop was, and what was actually dropped. The percentages here show how much extra was delivered to each pen.
- The first load had too much delivered to the pen … which usually means somewhere down the lane there are some cows that aren’t getting enough.
This load was mixed and delivered one day after setting up EZfeed. Again, nothing really changed from the feeder’s perspective … so this is a good representation of what was typical.
The interesting thing is that once the feeders were aware of what was going on and now had a goal in mind… you will start to see rapid improvement over the next few weeks.
Feeding with EZfeed Day 9 – A New Premix
The first thing the feed manager realized is that the small (and typically expensive) ingredients were too difficult to load properly. Within days, they had developed a strategy to create a premix of those difficult ingredients at the end of each day so that it could be used as one ingredient in the rations for following day.
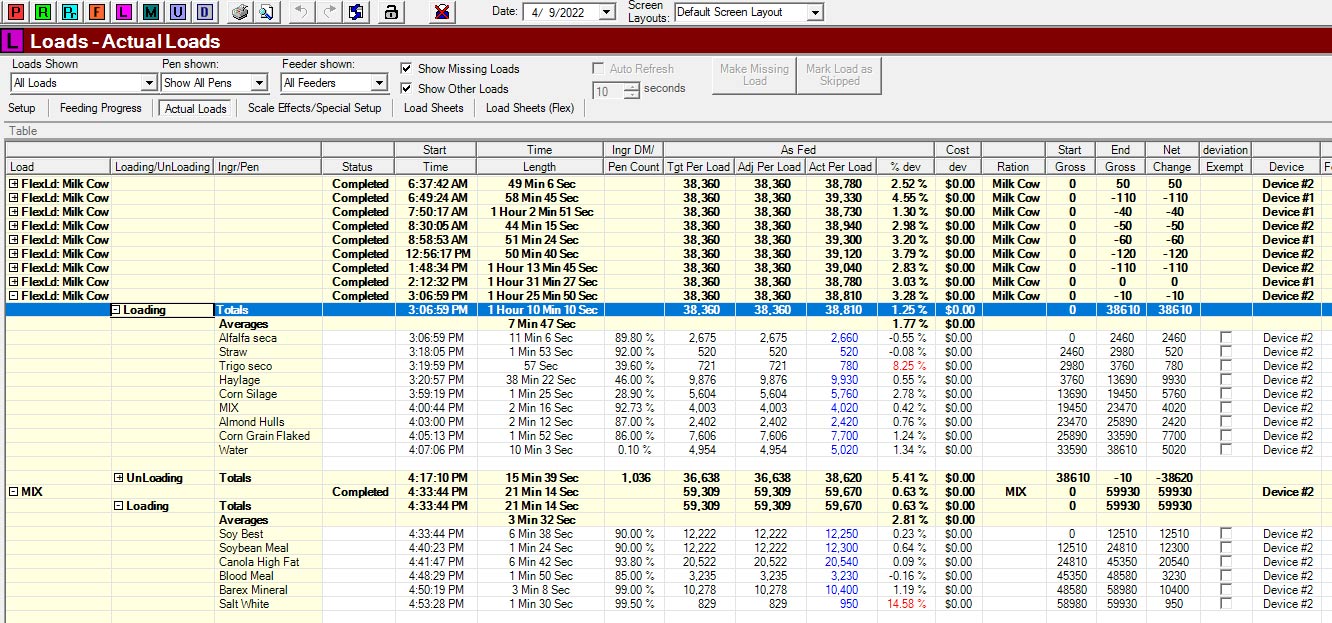
The EZfeed screenshot above shows a number of improvements:
- First off there is a new load at the end of the day called MIX … this is the premix of the smaller ingredients.
- During the day in the regular loads, the feeders were able to load these ingredients thousands of pounds at a time … their deviation in the example above was .42% – it's impressive how low that is!
- When they first started, their TMR deviation averaged about 25% -- now the average is down to 1.77%
That’s impressive improvement in just over a week … plus the premix is helping them save literally thousands of dollars a day!
Feeding with EZfeed Day 12 – Unloading
Just a few days later deviation averages are still looking pretty good … there is still room for improvement, but now everybody is aware of what can be improved.
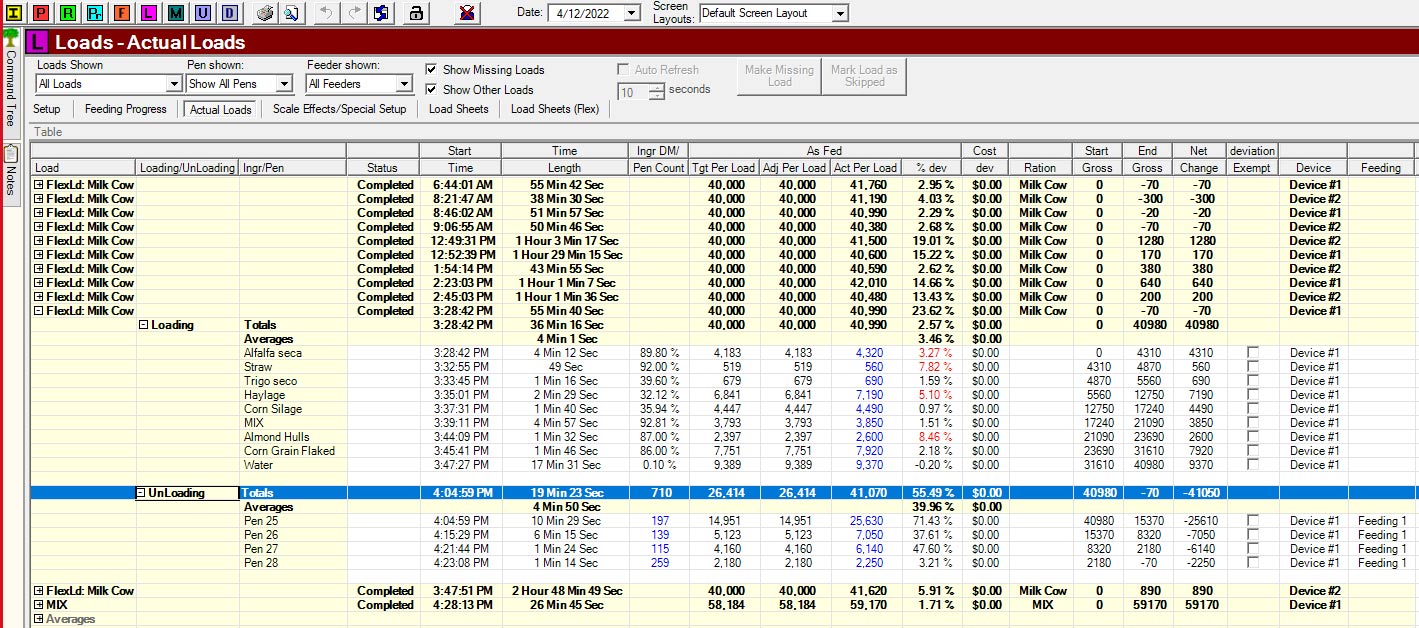
The next thing to tackle was being more consistent with unloading. The unloading averages were still pretty high - especially on the first pen being unloaded.
Feeding with EZfeed 2 ½ Months Later
A couple of months later, everybody had a chance to be aware of what was happening … but also began to understand how it could be improved.
We have some farms that post feeder deviation averages in the lunchroom creating a little healthy contest among the feeders. Some farms look at those deviations and reward their workers and their families with a pizza party when they keep the averages below a specific percentage over the course of a month.
Whatever the method, it helps to advertise the results and decide on an expectation for future results. Most dairies want their deviation averages below 2 percent.
Is that possible?
Look at the results 2 ½ months after installing EZfeed:
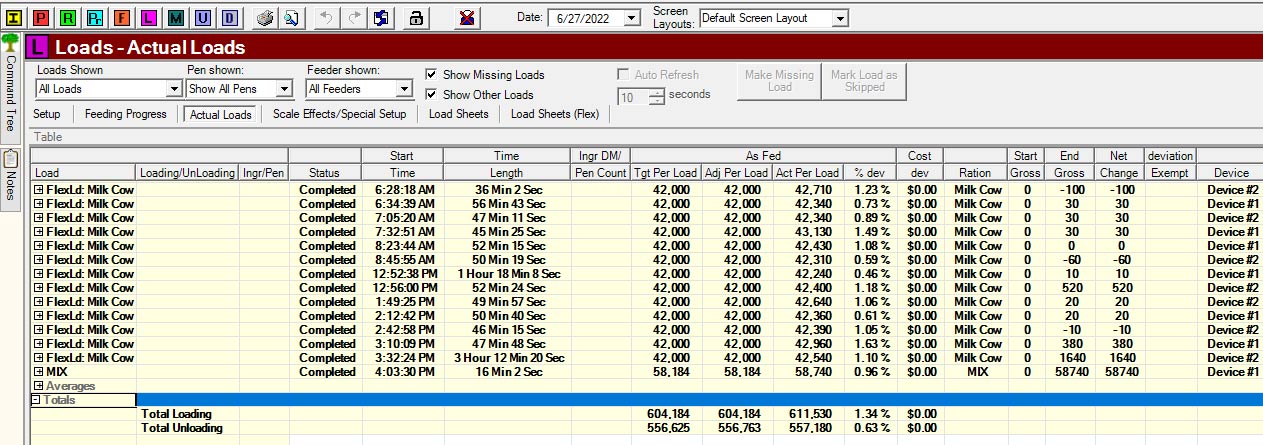
- Loading deviations for the whole day total 1.34%
- Unloading deviations for the whole day total 0.63%
Conclusion
Needless to say, the owner of this farm was pretty excited. I’ll bet with the right management approach, he also had an excited group of feeders – because they now contribute directly to the profits of the dairy every day!
How much money would you save if you went from feeding 25-85 percent too much of the ingredients you use -- to less than 2 percent? How much healthier would your cows be if they had the right amount of TMR put in front of them consistently every day?